

In this episode of Heat Treat Radio, Doug Glenn discusses the hardenability of materials with guest Michael Mouilleseaux, general manager at Erie Steel LTD. Michael walks us through how to interpret hardenability charts and provides detailed insights on reading these charts, including addressing the importance of understanding the nuances of complicated part geometry.
Below, you can watch the video, listen to the podcast by clicking on the audio play button, or read an edited transcript.


The following transcript has been edited for your reading enjoyment.
Understanding a Hardenability Chart (01:59)
Doug Glenn: What I’d like to do is talk through this chart and learn how to read this a little bit better. And I’d like to ask questions about it because I’m not familiar with this, and I’m sure there are going to be some listeners and viewers who aren’t familiar with it. This will be just a quick tutorial on how to read these charts.
Go to the upper, right-hand corner. First off, SAE 4320H is the grade of the steel that we’re talking about?
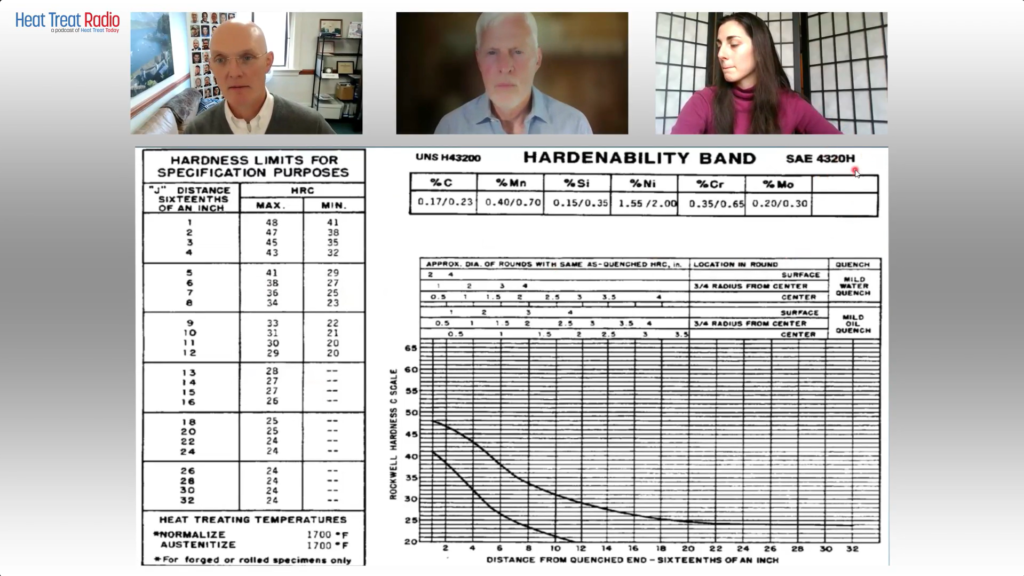
Use this chart to follow along with the conversation.
Source of chart: Erie Steel, Ltd.
Michael Mouilleseaux: Correct.
Doug Glenn: Then the table right below that you’ve got percentage C (carbon). Is Mn manganese?
Michael Mouilleseaux: Manganese.
Doug Glenn: Thank you very much. Silicon, nickel, chrome, moly. My question is about those ranges. Is this basically saying the percentage carbon on the far left in 4320H goes anywhere from 0.17–0.23?
Michael Mouilleseaux: That is correct.
Doug Glenn: Okay. So that’s variability right there. All of those are basically telling you what the ranges are in those alloys in this grade of steel?
Michael Mouilleseaux: That is correct.
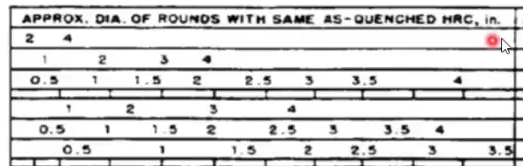
Doug Glenn: Then you go down to the top columns of this table below, and it says “Approximate diameter of rounds with same as quenched HRC in inches.” Right?
Source: Erie Steel, Ltd.
Michael Mouilleseaux: Yeah. Essentially, the first three rows are for water quenching. And the bottom three are for oil quenching.
Doug Glenn: If you go over to the second major column called “Location in round,” what’s the size of the round we’re working on here?
Michael Mouilleseaux: It can vary. Go down to where it says, “Mild Oil Quench,” then left to “Surface,” then left then go to “2 inches.” Then, go straight down to the bottom, and that’s approximately J5. So, the “Distance from Quenched End — Sixteenths of an Inch” is Jominy position 5.
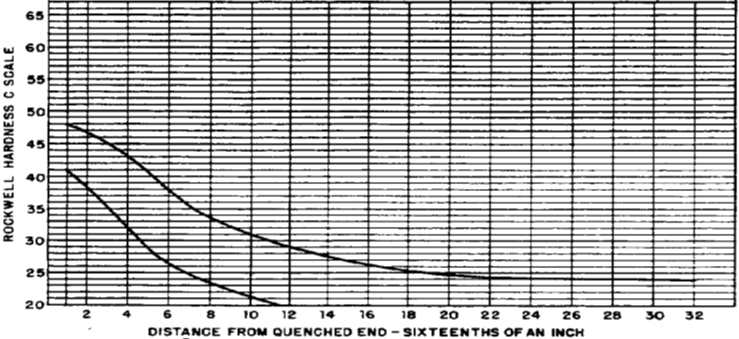
Michael Mouilleseaux: If you go to Jominy position 5 on the left-hand chart, you can see the hardness limits for that; the maximum is Rockwell C 41, and the minimum is Rockwell C 29. So, the chemistry can vary provided the hardenability at J5 is 29–41.
Doug Glenn: That’s the acceptable range?
Michael Mouilleseaux: That’s the acceptable range. That’s one way of looking at it. The chemistry would allow you to do that.
Now, go back to the chart on the right-hand side and to “Surface,” move down one row to “¾ radius from center,” and go left to two inches. Moving down from there you see that is Jominy position 8. So, the surface of a two-inch round is Jominy position 5, and the ¾ radius is Jominy position 8.
If you go to the hardness chart on the left-hand side, that says that if you had a two-inch round of 4320H, and it was oil quenched, and you check the hardness at ¾ radius, then the expectation is that it would be 23–34.
Now, go back to the same chart that we were just at, and go to the “Center” row of “Mild oil quench.” Continue left to two inches, and that’s J12. Go back to the left-hand chart, and J12 is 20–29 in the center of the part.
So, the surface of the part could be 41, ¾ radius, center of the part would be 34, and the center of the part would be 29.And that would all meet the criteria.
Doug Glenn: The maximum for J5 would be 41.But at J12 you could get a 20 in the middle.
Michael Mouilleseaux: Right. That is one way to look at this chart. But there is another way.
Notice that it says “rounds.”There are some nuances to having flats and rectangles because, if you think about it, for the cross-sectional area of a rectangle, the hardenability is going to be determined by the direction that it is thinnest, not by the direction that it is thickest.
Take a gear tooth, for example: in the chart that we just made up the gear teeth, the root of the gear was about a half inch, just slightly more; and if we go to this same chart, go to “Center” of “Mild oil quench,” and then go to a “0.5 inch,” and when you go straight down, that’s the J3.
Is a gear necessarily a round? Of course, the answer to that is no. So, in complex shapes you can use this data, but you have to interpolate it in order to understand it.
To some extent, the first time you run this, you’re going to say, “I have a gear, and the root is a half inch across. And I know that the J3 is 40. And I’ll run this part, and I’ll section it and I’ll measure it and it’s 40. And I’ll say that’s a good approximation of that.” And experientially, you build confidence in this, that is, it’s your operation, your quenching operation, and your components. It allows you to interpolate these, and they become extremely useful.
So, is it definitive? No. Is it useful? Yes.
Doug Glenn: It gives you a ballpark, right? I mean, it’s giving you something, maybe guardrails.
Michael Mouilleseaux: It gives you a ballpark; it gives you guardrails. And I can tell you that after having run gear product in the same equipment for ten years, I can say that it’s definitive. I can say that if I have this hardenability, and I get this hardenability number for this heat, and these gears are made from this heat of steel, and it has a J3 of 42. If I’m at 38, I know something is going on other than just hardenability. And, at that point, I would suspect my heat treat operation.
Doug Glenn: Yeah. I have one more question about this chart: On the bottom right part of the graph there are two plot lines on there. What do those represent? I was thinking one represented the water quench and the bottom one represents the oil quench.
Source: Erie Steel, Ltd.
Michael Mouilleseaux: The top one represents the maximum hardenability. And the lower the lower one represents the minimum hardenability.
Doug Glenn: That’s your band. Okay. Those are basically your values over on the left-hand side then. Very good.
I don’t know about you, but I found that helpful. I really didn’t ever know how to read these tables. So, maybe someone else will find that useful. Thanks, Michael. I appreciate your expertise.
Michael Mouilleseaux: It’s been my pleasure.
About The Guest

General Manager at Erie Steel, Ltd.
Sourced from the author
Michael Mouilleseaux is general manager at Erie Steel LTD. Mike has been at Erie Steel in Toledo, OH, since 2006 with previous metallurgical experience at New Process Gear in Syracuse, NY, and as the Director of Technology in Marketing at FPM Heat Treating LLC in Elk Grove, IL. Having graduated from the University of Michigan with a degree in Metallurgical Engineering, Mike has proved his expertise in the field of heat treat, co-presenting at the 2019 Heat Treat show and currently serving on the Board of Trustees at the Metal Treating Institute.
Contact Mike at mmouilleseaux@erie.com.

Pubisher
Heat Treat Today

Managing Editor
Heat Treat Today